Condence team is continually working on making updates and improvements to the sampling and visualisations of the asset health. Condence monitoring technology is built on taking samples of the assets health parameters and doing analysis and visualisations of it, continuously.
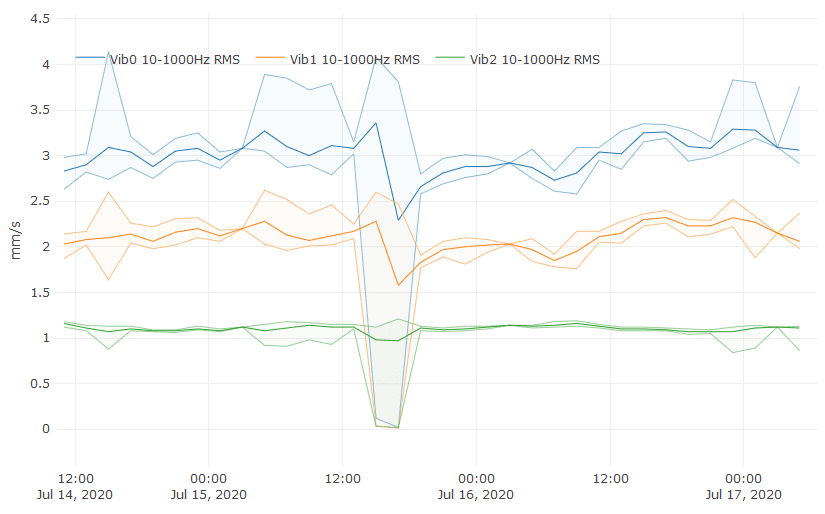
On our latest release, we have improved both, the actual measurement and how the metric is visualised in the cloud UI. In other words, the user can get more out of each measurement. Users are now able to see the full range of values, meaning maximum, minimum and average value of the metric from the period between the current and previous sample.
The new feature enables fast analogue channel monitoring. For instance, we are now able to detect quick changes in important asset health parameters like torque or current draw of electric motors. The update allows for practically constant measurement of analogue channels lifting the resolution to millisecond level. Users are of course able to set notifications and alarms to any of the newly added values.
The driver for the feature was to enable torque measurement and other rapid phenomena measured with sensors in analogue channels. But the visual component is without a doubt useful in monitoring other health metrics and parameters such as vibration analysis as well. The feature is automatically in use on Condence T200 & T210 terminals with software version 2.3.0 and higher. Users can toggle the min/max/avg feature on in the metrics trend component, or it can set as the default selection in the view templates.
0 Comments